Data Lineage
This module allows the visualization of the information life cycle, as well as the interconnection between each system of the organization, which allows to have a complete traceability of the data, as well as impact analysis in the event of possible changes in data structures or processes.
Upon entering the lineage module, we will have the option to select the resources for which we want to perform the analysis as well as what type of analysis we want to do:
Traceability: We will obtain the origin of the data. Where does our data come from?
Impact: You will inform us of the use of our data. Who are the consumers of my data and to what extent does it impact?
Levels: We will define the number of levels that we want to be painted on the screen to be able to navigate. This is especially useful for complex pegs where viewing the entire graph makes understanding very difficult.

Once the analysis to be carried out has been chosen, a graph will be painted where you can see who are the consumers of our data and the flow that they follow.
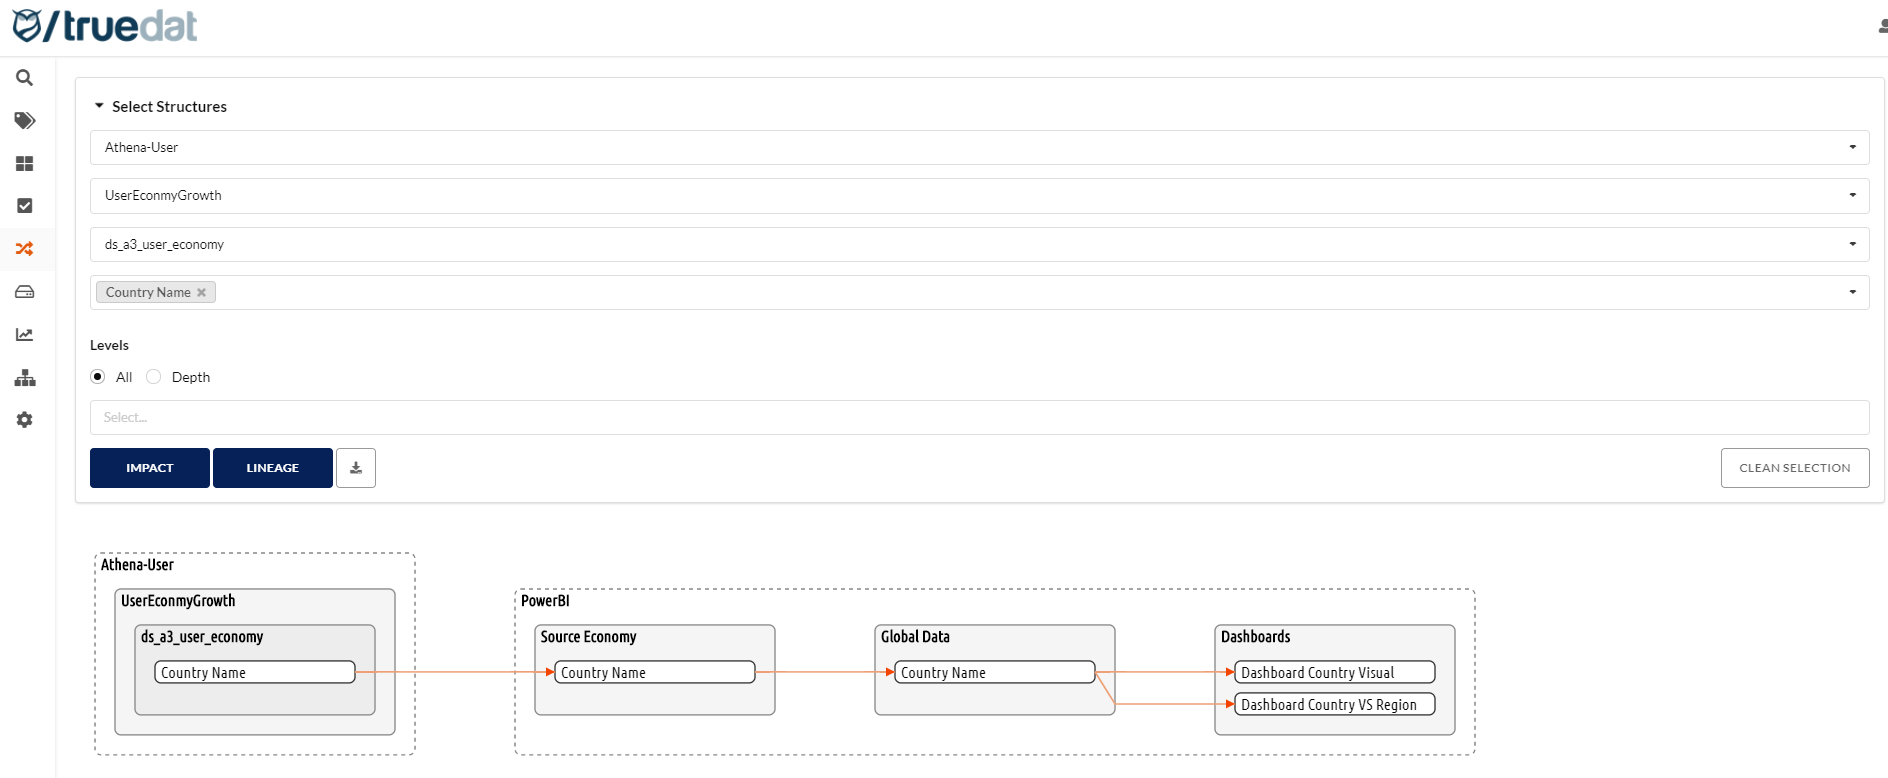
In case of choosing a traceability analysis, we will observe that the arrows point in the opposite direction. This is because the arrows always show us the direction in which the data moves.
For cases in which the name of an object is cut off because it is too long, we can put the cursor over the name to be able to view it completely.
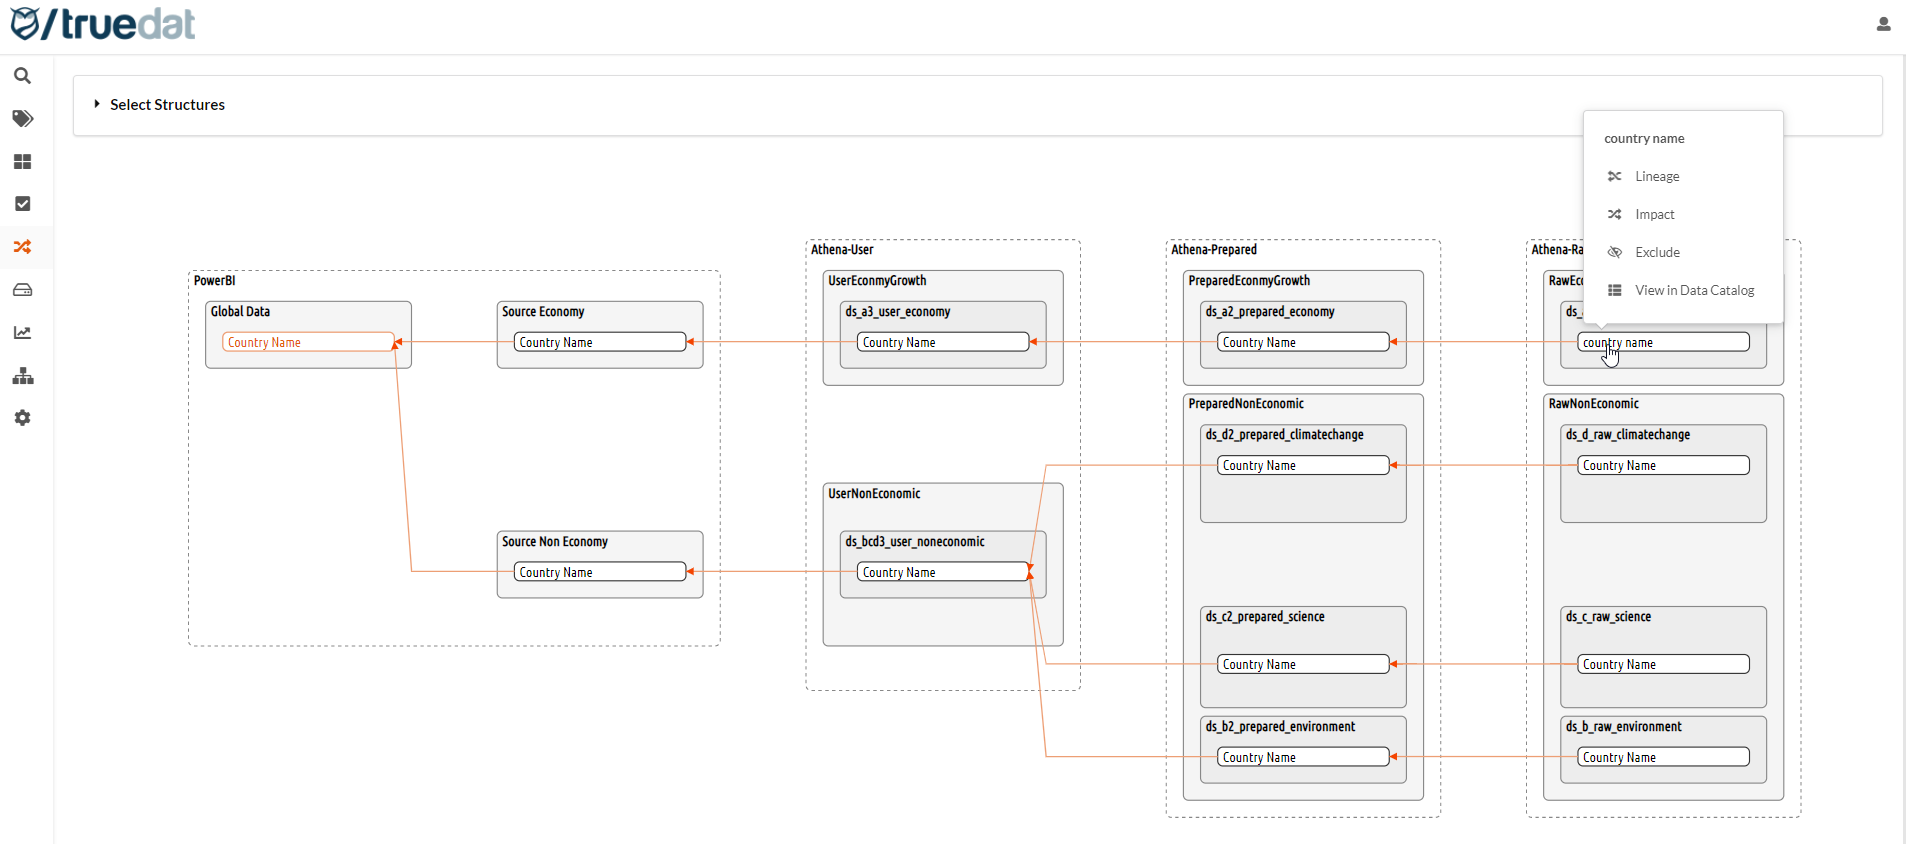
Once you have requested your graph you will be allowed to download lineage information into a csv file to be opened with MS Excel. This csv will represent all groups displayed in the lineage graph and the relation between these groups. Also the relation between resources in the graph (arrows) will be represented as a line in the file.
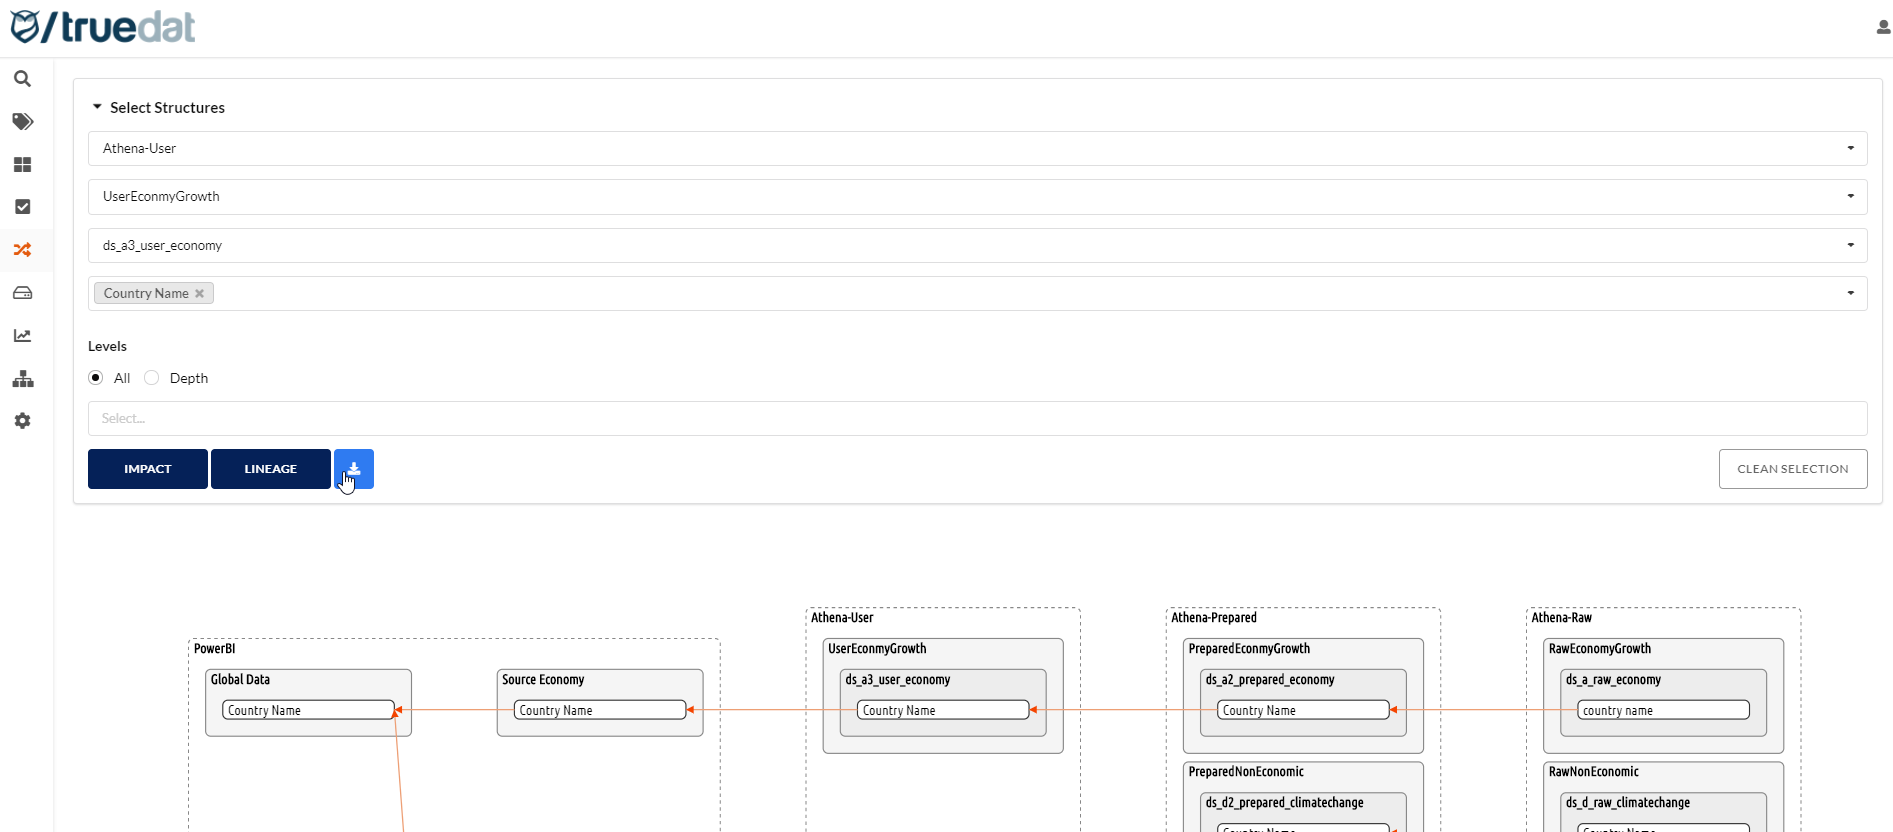
Additionally, by clicking on the different objects represented in the graph, we will obtain different options:
Traceability: We will navigate to the traceability analysis of the selected object.
Impact: We will navigate to the impact analysis of the selected object
Exclude: The selected node and any links it may have will be removed from the graph, recalculating to paint it in the optimal way based on the current selection.
View Data Catalog: This option will only appear for those elements that are available in the data catalog. By selecting this option we will navigate to the catalog to see the details of the selected item.
If the linage connector provides information on the process, this can be viewed by clicking on the arrow that connects the objects.
Data Lineage background process
Some lineage graphs might be very complex and that will require the process to calculate them for a long time. When installing Truedat you will be able to decide the maximum time given for a lineage calcuation.
When requesting such a graph you will see in the screen that the lineage is being calculating.
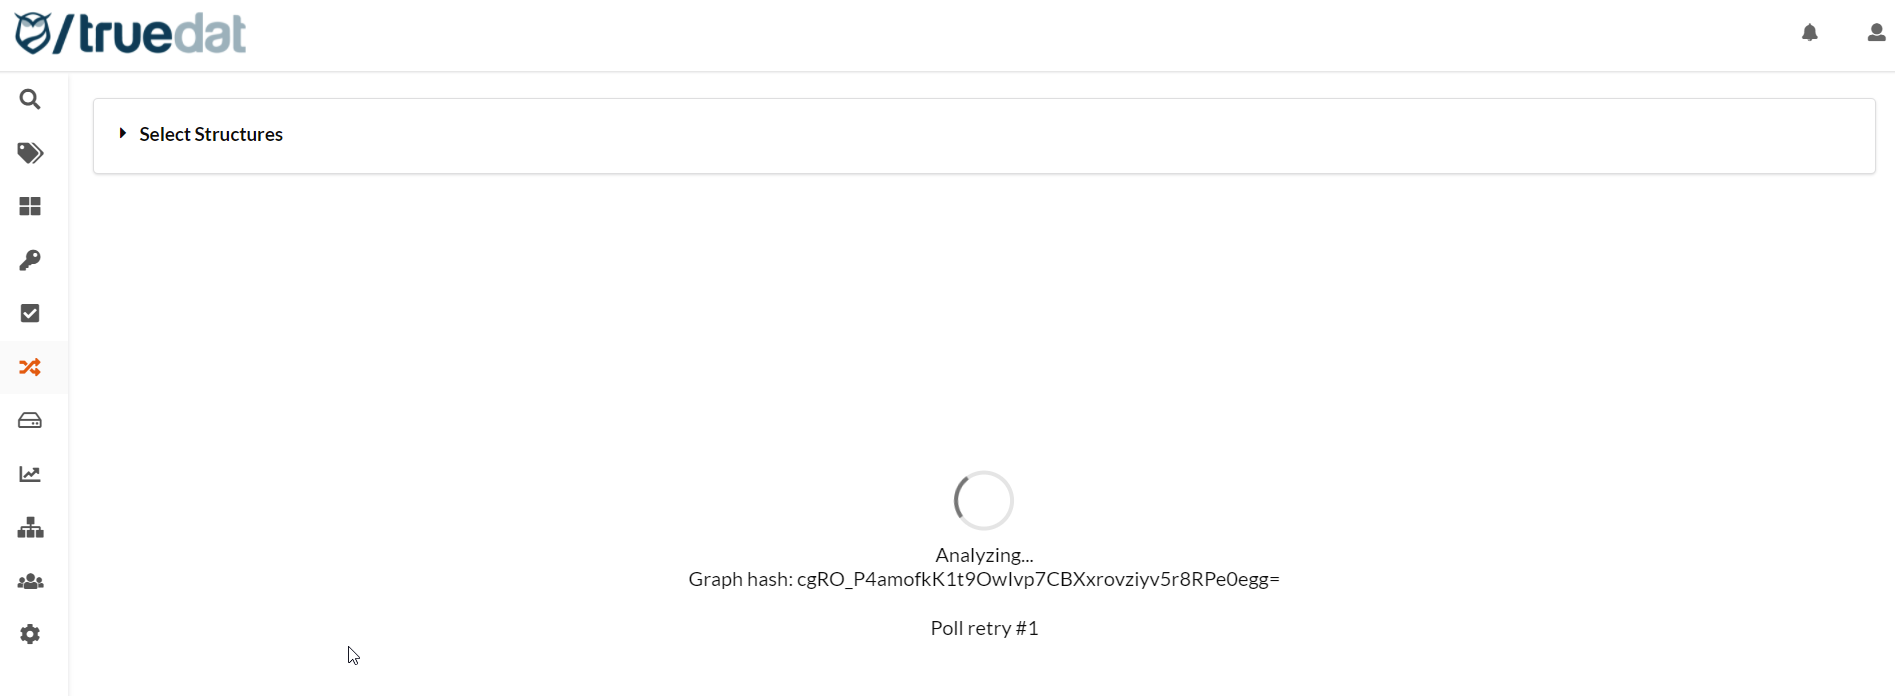
You do not need to stay in this screen to way for the result. You can leave the process running and come back to see the status after a while after the option "My Graphs" in the lineage menu.
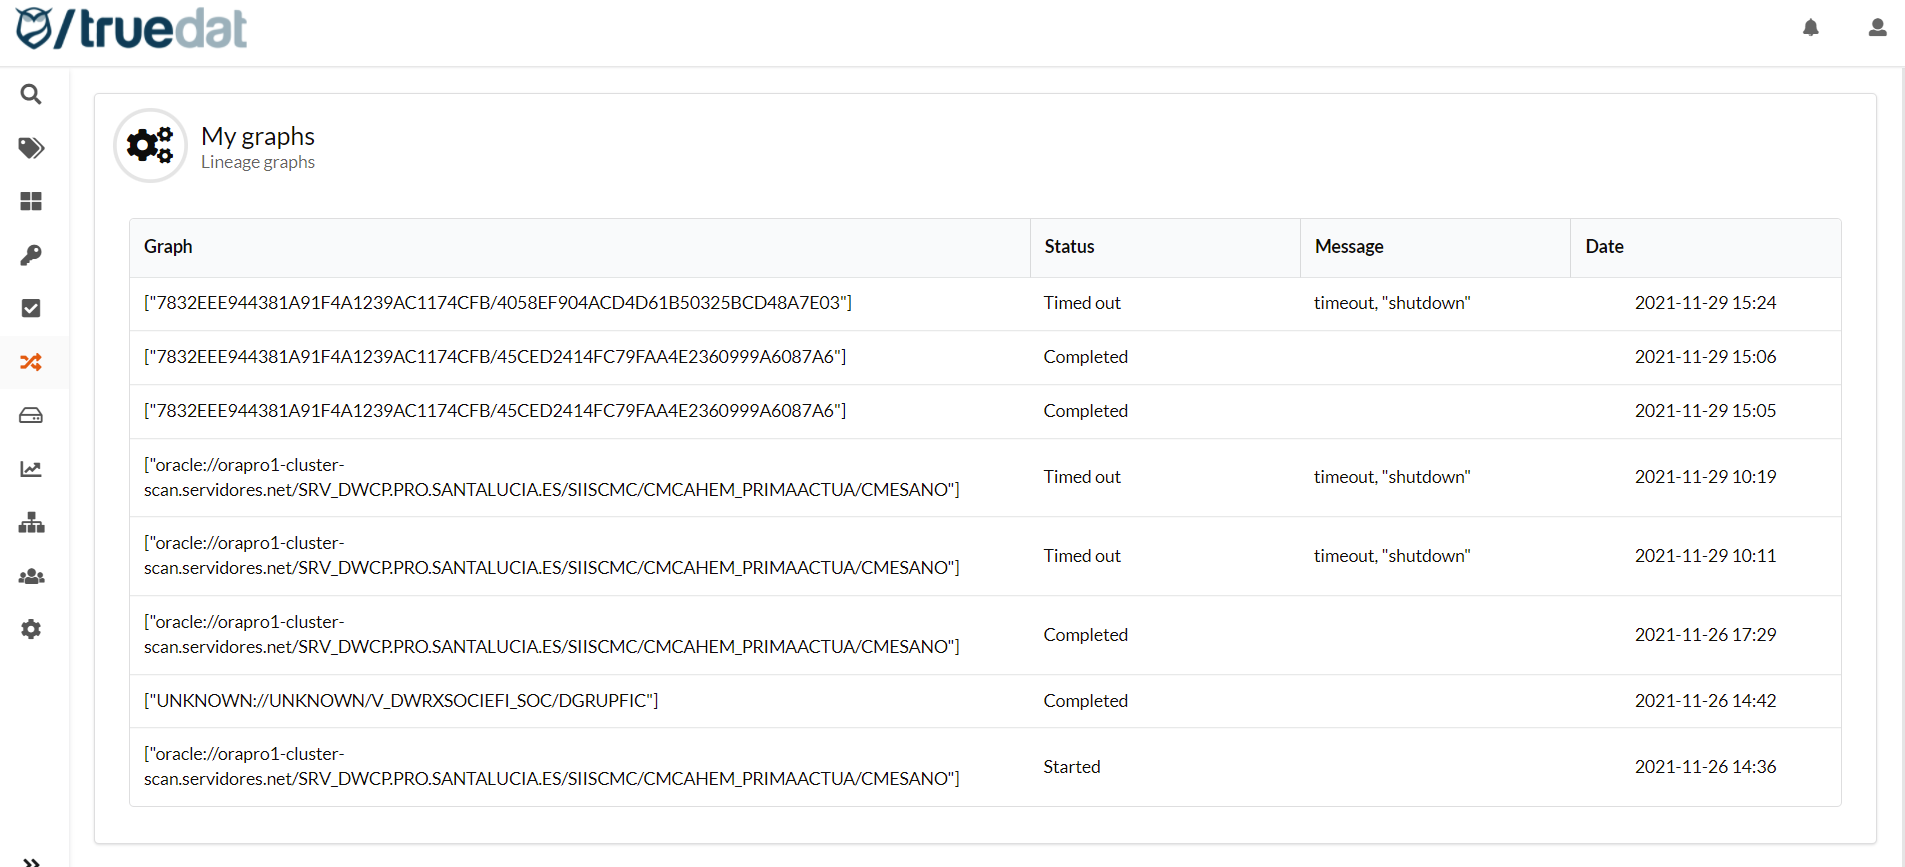
Once you have a graph calculated the next time some requests the graph with same parameters it will use cache information with a ver low cost to display the graph.